


⚖️ Weighting for November
This Isn’t Just About Polling. It’s About Trust.


Editor’s Note
I began writing this Substack column with a very clear goal: to stay unbiased, non-partisan, and data-driven.
Not going to lie — that’s hard to do when you watch the media amplify a poll like Rutgers-Eagleton’s without question. Headline after headline declared Mikie Sherrill with a “20-point lead.” No context. No scrutiny. Just blind replication. And it’s misleading. Worse — it’s wrong.
It’s also the Fourth of July weekend, and that makes me think of freedom.
I’ve learned that there are very different views of what freedom means in this country. But I can tell you, with absolute certainty, that when you’re outside of America looking in, there’s only one view—the freedom you don’t have.
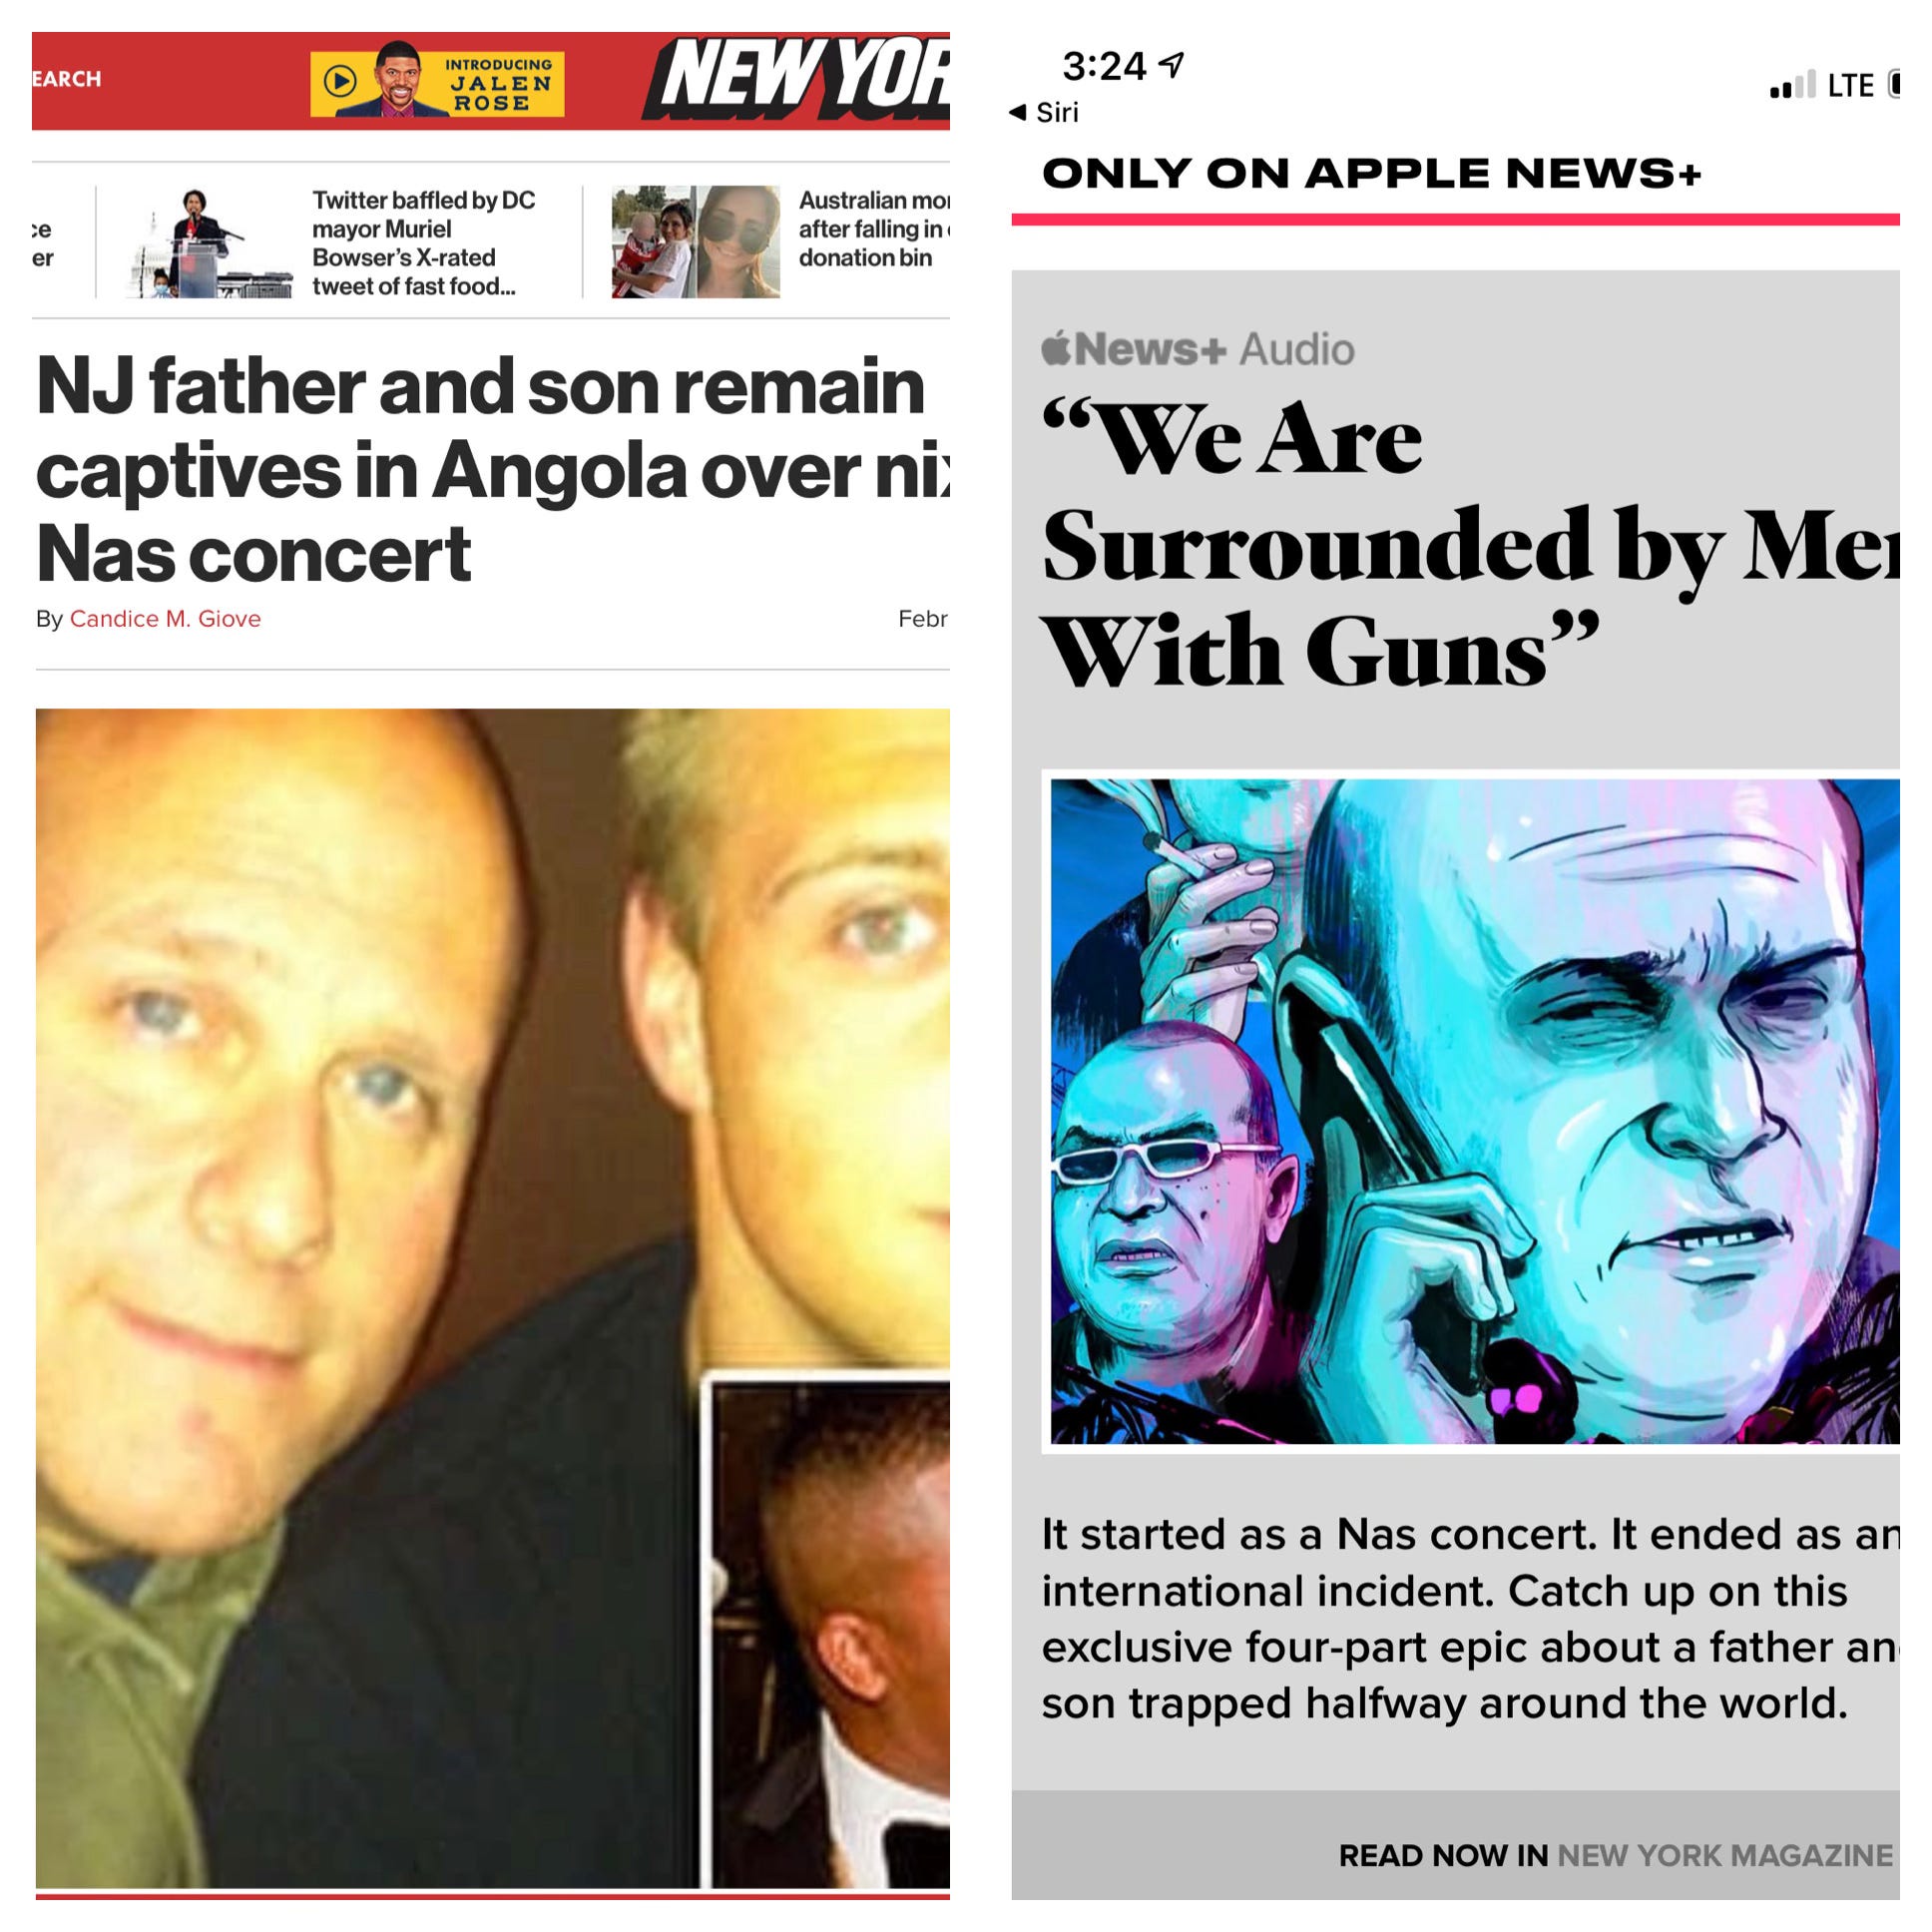
In 2012, my son and I were taken hostage in Angola for 50 days. It took Republicans, Democrats, and the full might of the United States government to bring us home. For 48 of those days, I told our story through Twitter and Facebook—knowing I had no First Amendment right in Luanda. I spoke anyway.
So as we continue to celebrate our independence and our freedoms this popular holiday week, and as we move into New Jersey’s general election and the 2026 midterms, I leave you with this:
Our political differences must never degrade our freedom.
And our freedom must never excuse misinformation.
Eagleton.
On July 2, Rutgers-Eagleton dropped their first general election poll of the season:
Mikie Sherrill 56%,
Jack Ciattarelli 35%.
A 21-point race. Leaners included. The poll was in the field just days after a divisive primary.
Eagleton dropped the number. The media repeated it. Nobody stopped to ask if it was real.
The Eagleton poll is an outlier—and we’re saying that plainly. If they’re wrong again, like they just were in 2021, again in 2024, and then in this year’s primary, then maybe an apology isn’t enough this time. Maybe it’s time for accountability.
💥 You heard it here first — when organizations release numbers this far off, they’re not acting like pollsters. They’re acting like fiction writers with a grant.
But this isn’t just about being “off.” Here’s the real danger:
📉 Outlier polls distort expectations. When voters are told a race is a blowout, many check out. Why volunteer, donate, or even vote, if the outcome seems predetermined?
💸 They can choke off fundraising. Major donors and national committees look to public polling to assess viability. An artificial 20-point gap can freeze money in its tracks.
📺 They shift media coverage. Lazy outlets regurgitate toplines without scrutinizing methodology. One faulty poll becomes the dominant narrative.
🧠 They erode trust in polling itself. When final results contradict public polls by 15 or 20 points—as they did in 2021 and again this year—voters start to believe the whole process is rigged or irrelevant.
🧭 And worst of all: they mislead voters. Elections are about persuasion, mobilization, and coalition-building. Publishing skewed numbers distorts the playing field for everyone involved.
Let’s rewind to April 25. Vote-by-mail ballots were already in homes across New Jersey. People were voting. And Eagleton published their final Democratic primary poll:
Sherrill at 17%.
Fulop 12%.
Spiller 10%.
Baraka? Tied for fourth with Gottheimer 9%.
We had Sherrill ranked #1 among Democrats every single week since January. We never dropped her. But we never once saw her struggling to get out of the teens.
What happened next wasn’t subtle: Sherrill won the primary by over 100,000 votes. High turnout. Big spread. Fulop and Baraka split the progressive vote. Spiller, who had major outside spending, showed modest strength mostly in South Jersey. The race was loud, late-breaking, and regional. ZPI called the broad shape of it months out.
Eagleton missed it all. That’s not just a bad guess. That’s a failure to understand how voters behave when they actually show up.
📉 Why Eagleton Keeps Missing
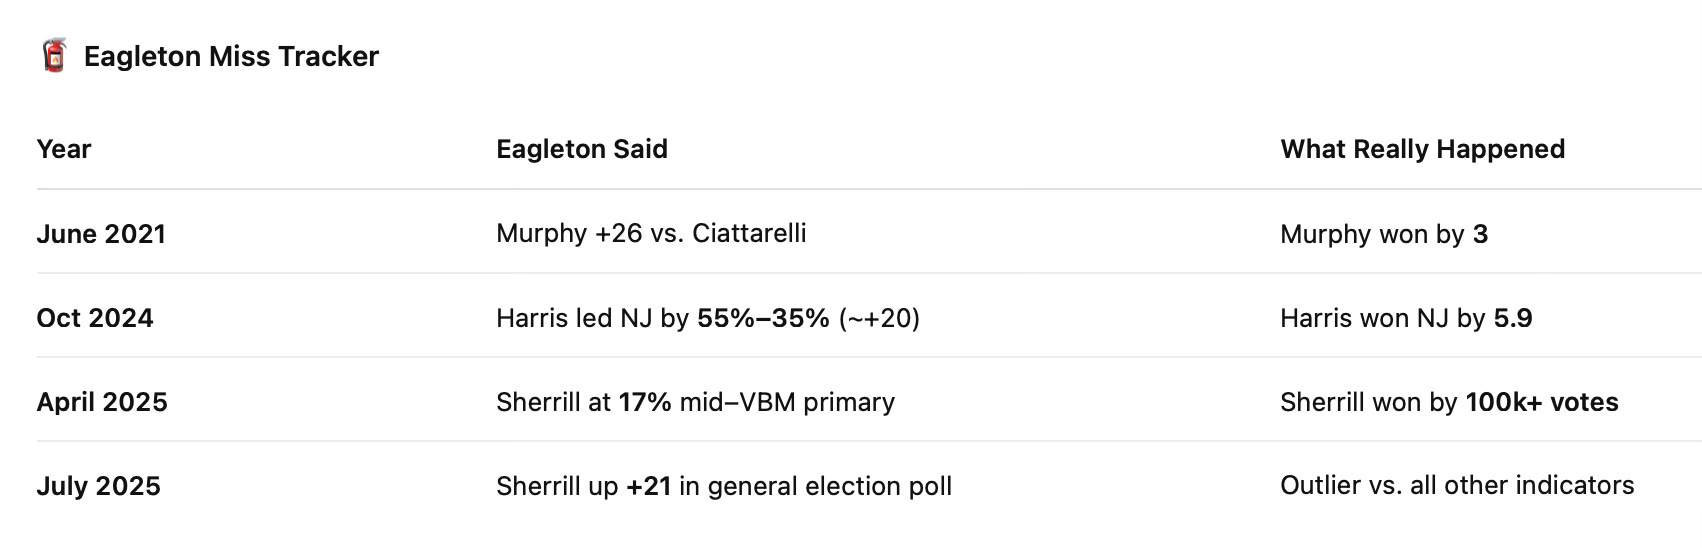
Let’s start with 2021: Eagleton had Gov. Phil Murphy up by 26 points in June — but he won by just 3 points in November. That kind of margin swing deserves more than a shrug.
Then in 2024, Eagleton’s October poll showed Kamala Harris cruising with a double-digit lead in New Jersey. She ended up winning the state by just 5.9% — well below the public polling consensus.
And most recently, as previously referenced, in 2025: Eagleton’s April 25 Democratic primary poll had Mikie Sherrill stuck at 17% — while ballots were already being mailed. They misranked the rest of the field too: Fulop, Spiller, Gottheimer, and Baraka all came in far from their projected positions.
Now they claim Sherrill holds a 21-point lead over Ciattarelli. But once again, the same flaws persist: Eagleton continues to sample “adults,” not likely voters, and leans on static turnout assumptions in an era of mass mail voting and shifting coalitions.
Ciattarelli strategist Chris Russell was blunt in his criticism, calling the latest poll “a steaming pile of shit,” citing Eagleton’s reliance on “a turnout model that is pure fantasy” and noting, “Unweighted data should not look like this.” He pointed out that respondents claimed to have voted for Kamala Harris 65–35 in 2024 (actual: 52–46) and for Phil Murphy 72–28 in 2021 (actual: 51–48), calling those margins “not serious.” (New Jersey Globe, July 2, 2025)
Polling isn’t just about what people say — it’s about what they do, and when they do it. Eagleton’s methodology is stuck in the past. That’s why ZPI tracks real-world behavior: registration changes, turnout trends, and platform sentiment across multiple ecosystems — all in real time.
Because elections aren’t won with margin-of-error modeling. They’re won with motion — on the ground, online, and at the ballot box.
📊 How It Compares
Last month, Democrats for Education Reform (a group openly backing Sherrill) released a poll conducted by SurveyUSA:
Sherrill 51%
Ciattarelli 38%.
A 13-point race. That already raised eyebrows.
The Ciattarelli campaign’s internal poll from National Research showed a statistical toss-up with Sherrill up by 3.
Our model at ZPI—built from 24 weeks of data collection, platform scraping, voter registration updates, and turnout calibration—currently has Ciattarelli up by 1.9 rank points. That’s not a partisan guess. That’s based on actual movement, patterns in the electorate, and a live understanding of who’s engaged, and who’s drifting.
So when Eagleton says Sherrill is up 21%? We say: show us your work. Because we show — and tell — every week.
⚖️ ZPI Weighting: The Real Work Has Begun
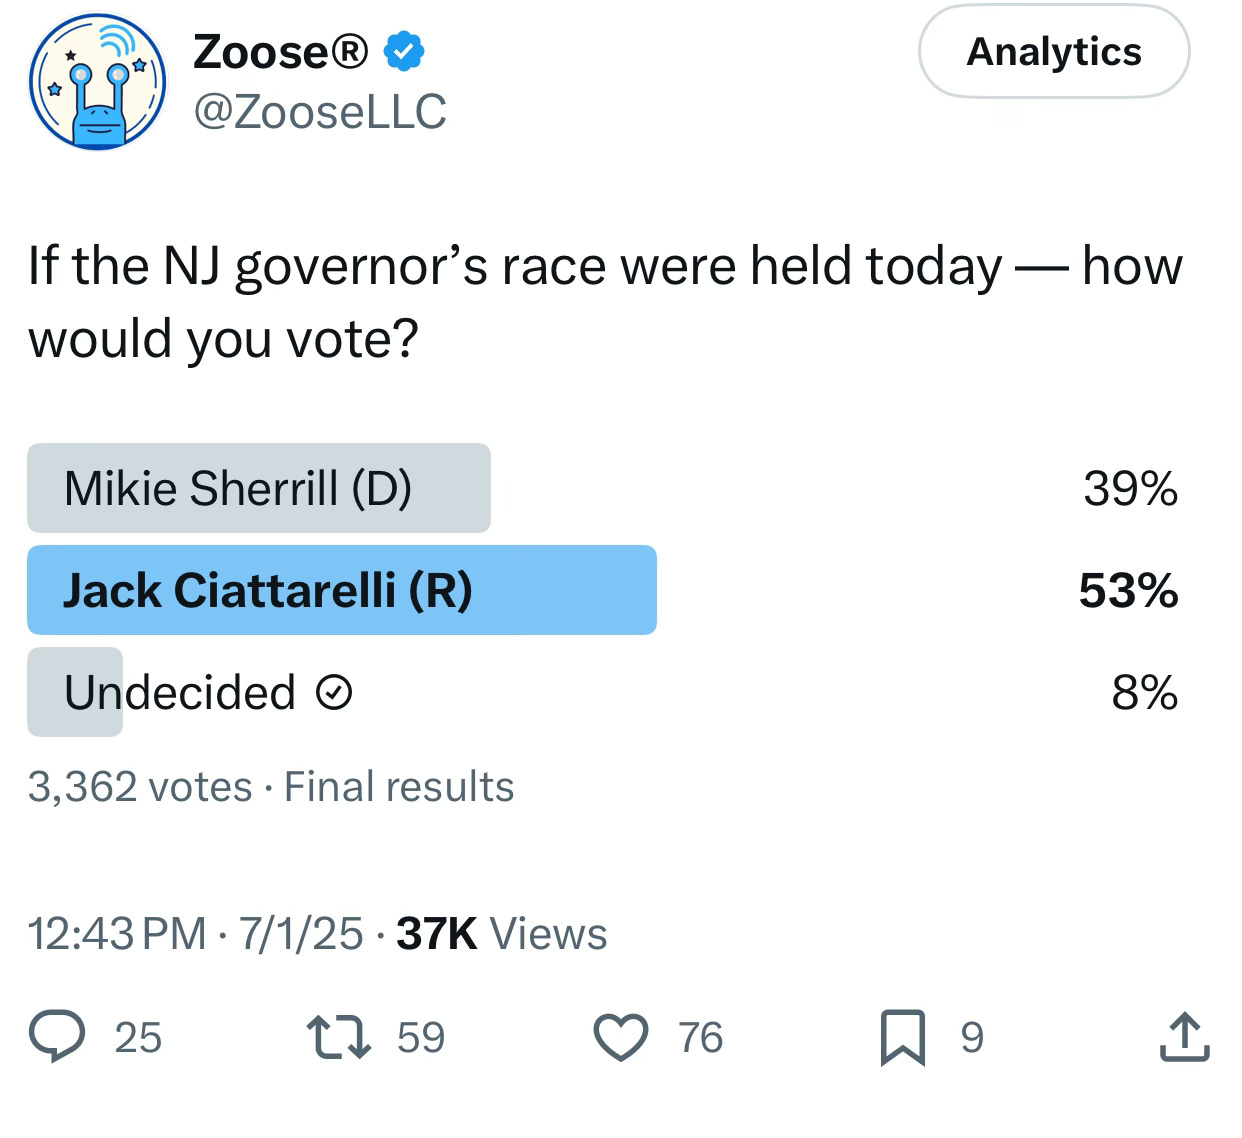
Between July 1st and 5th, we ran a live poll on X. The topline numbers were eye-catching: Jack Ciattarelli 53%, Mikie Sherrill 39%, with 8% undecided. The poll drew over 3,362 votes, more than 37,407 views, and 7,139 engagements, 59 shares, 76 likes, 25 comments. But we didn’t release those numbers as gospel — because we know better.
What we do know is who voted.
The poll was geofenced to New Jersey, filtered to adults 18 and older, and captured a politically engaged slice of the electorate. Of those who responded: 72.4% were male, 27.3% female, and nearly 78.9% were under the age of 40. That’s not a perfect mirror of the New Jersey electorate — and we don’t pretend it is. But it’s not noise either. It’s a signal. And we calibrate it.
👁️ What the X Poll Tells Us (July 1–5)
📈 Exceptionally High Engagement:
37,407 views and 3,362 votes make this one of the largest geographically targeted political sentiment snapshots we’ve seen on X this cycle.
📊 Stable Margin, Strong Signal:
The Ciattarelli +14 spread didn’t wobble. It held steady across all five days — a clear sign this wasn’t random volatility, but a consistent lean among respondents.
🤝 Active, Not Accidental:
With a ~9% vote-to-view ratio and over 7,100 total engagements, this wasn’t casual traffic. Users didn’t just scroll — they acted. That’s the kind of behavioral intent we model from.
🧲 Filtered by Design, Not by Accident:
Geofenced to New Jersey, limited to users age 18+, and organically surfaced to politically engaged accounts. This wasn’t a paid focus group. It was a live read of who’s paying attention — and participating.
Beyond votes and views, the poll was shared 59 times, liked 76 times, and drew 25 comments — subtle signals, but telling. A share often signals alignment, not just interest — someone wanted others to see the result. A like suggests emotional approval or affirmation. And a comment? That’s effort — it means the post sparked a reaction strong enough to speak out. Together, these actions hint at how voters feel about the numbers — not just how they engage with them.
This is where Zoose makes its mark.
We don’t treat every post—or every platform—the same. Each one speaks a different dialect of digital behavior. And we model accordingly.
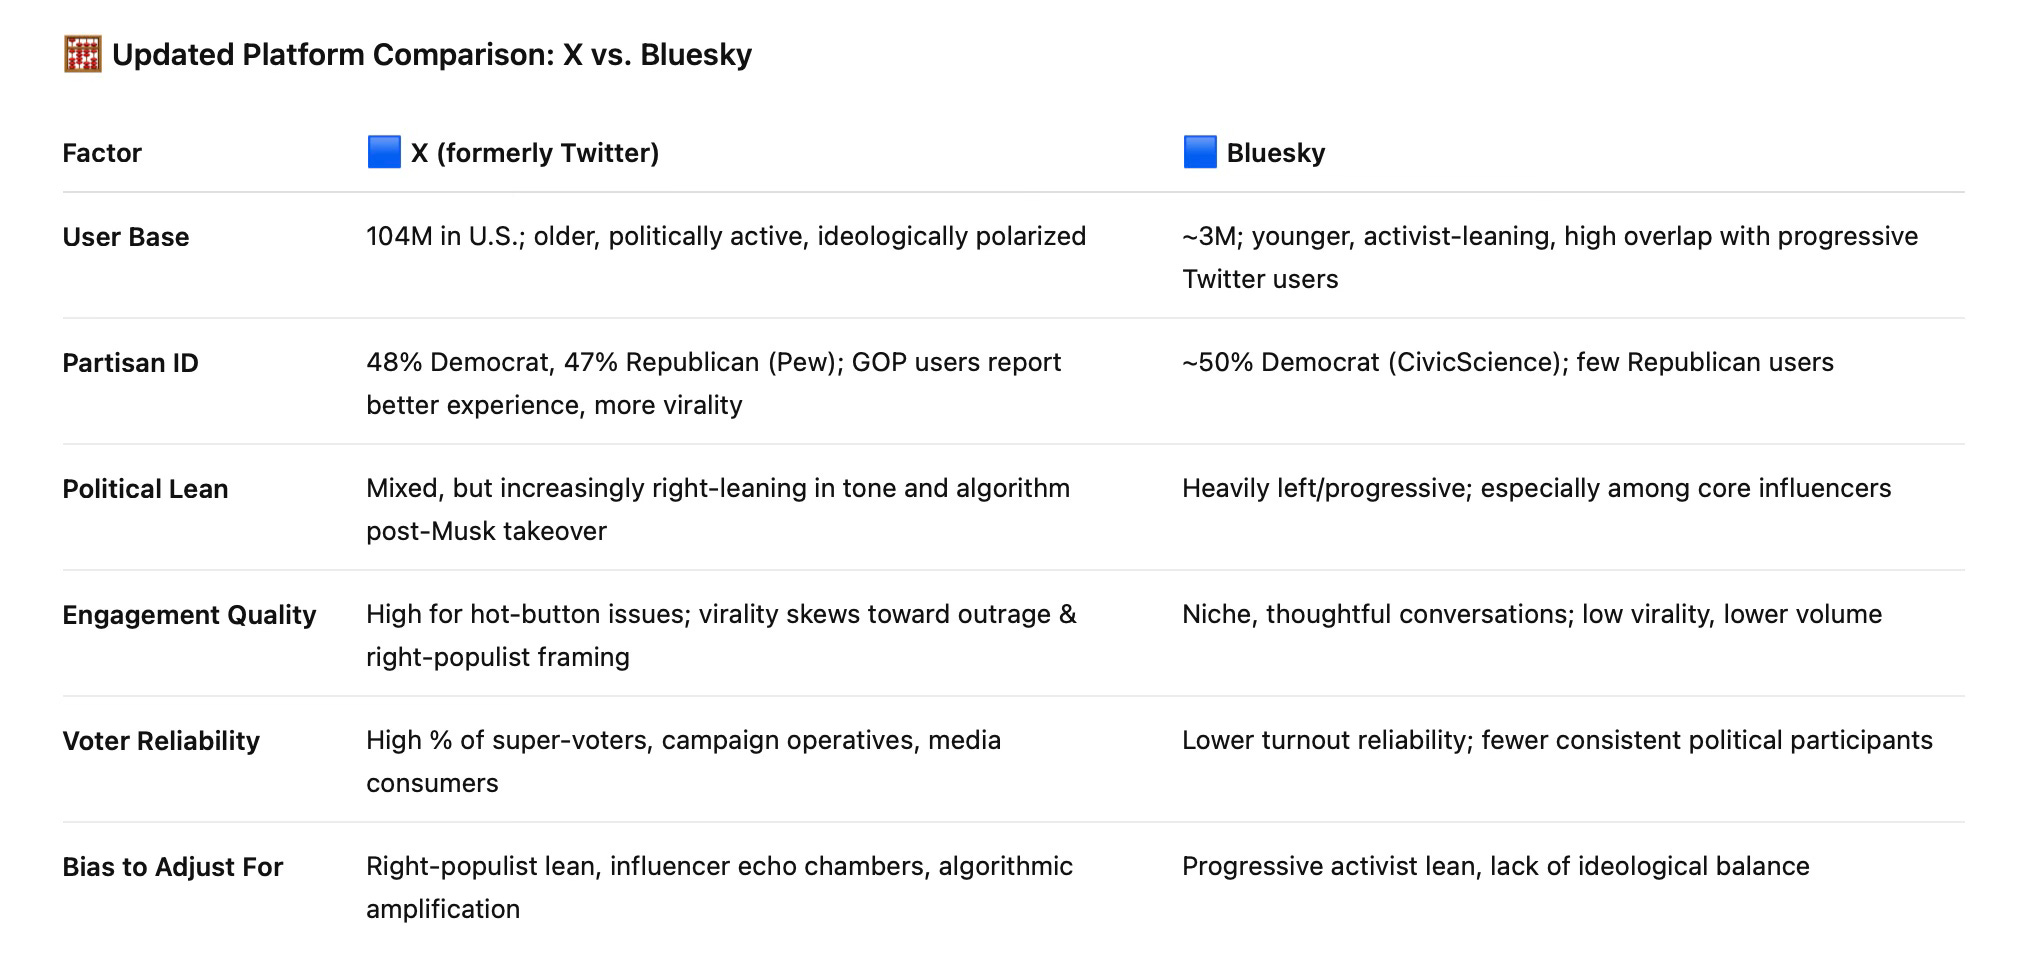
Take X, for example. With over 104 million U.S. users (2.6M to 3M in NJ), it has a nearly even partisan split—48% Democrat, 47% Republican—but algorithmic shifts have made it more comfortable terrain for the right. Engagement is loud and fast, often driven by campaign operatives and media surrogates. Voter reliability is high here, but so is ideological polarization. So when we see Ciattarelli overperforming on X, we don’t assume that margin holds. We correct for right-populist lean and filter out media-pundit noise.
Now contrast that with Bluesky. It’s smaller—just ~3 million users nationwide—and overwhelmingly progressive. Nearly half of Bluesky users identify as Democrats, and platform influencers tend to skew left. But engagement here is lower volume and less emotionally charged. It’s a good read on activist sentiment, not necessarily turnout probability. So we scale Bluesky’s results against broader engagement trends and voter-file behavior.
We apply the same lens across other platforms:
Truth Social: Heavily MAGA, low engagement breadth—great for signaling base energy, not persuasion.
Facebook: Still the best read on suburban and older voters, especially in union-heavy or community-centered groups.
TikTok: Youth-driven, unpredictable—but trend surges (like Cop Girl) can foreshadow movement days before it shows up in polls.
Reddit: Skews young, cynical, and disproportionately male—useful for tracking issues, not candidates.
In short: we’re not here to churn out numbers. We’re here to understand them. To dissect behavior in real time. We weight platform lean, sentiment drift, and how undecided voters make up their minds. We calibrate week by week, across every signal we see.
The Zoose model integrates more than polls.
We map campaign fundraising, field operations, structural strength, regional momentum and GOTV. We don’t just log voter sentiment — we model turnout likelihood. We’ve been refining this adaptive system week by week for over six months, calibrating it with new inputs and field-tested outcomes. It’s built to evolve. Built to correct. Built to see past the noise.
We could’ve just released our poll results. After all, our sample was more than 5.4 times the size of Eagleton’s. But that’s not how we work.
📐 So What Would This Poll Look Like After Weighting?
Raw numbers aren’t reality. They’re reflections — and sometimes those reflections are warped by platform bias.
On X, engagement skews male, younger, and slightly rightward. Our poll reflects that: 72% male, 78% under 40, and a Ciattarelli +14 margin that held firm over five days.
But what happens when we model for what that group misses?
Using historical turnout trends, age-based weighting, and known platform skews derived from thousands of data points, we estimate that X polls currently overstate Republican strength by 6 to 10 points.
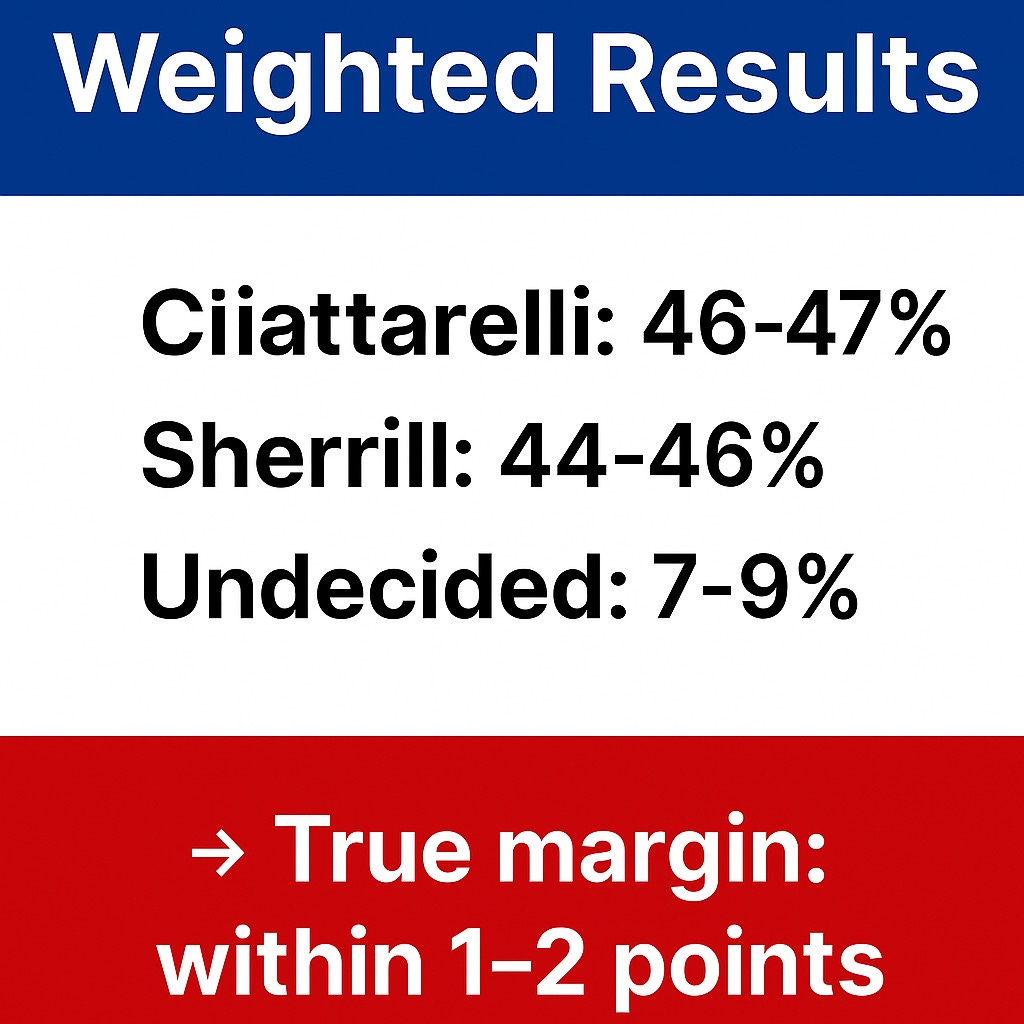
That 6 to 10 point lean is subtracted from Ciattarelli’s topline and redistributed proportionally — a conservative recalibration that narrows the gap while preserving turnout dynamics. Adjusting for that, the race looks far tighter. That’s not just a guess. It’s calibrated insight — consistent with our ZPI score, which currently has Ciattarelli ahead, 91.2 to 89.3. The poll reflects digital momentum. The adjustment reflects electoral behavior.
We don’t rely on intuition. We use our proprietary AI weighting engine, trained on six months of voter behavior across multiple platforms. The full recipe is confidential — but the outcome is visible every week in the Zoose Political Index.
This is the heart of our approach: calibrate for bias, extract signal from noise, and model what voters will do — not just what they say online.
We’re not polling to prove a point.
We’re tracking to tell the truth.
We’re weighting for November.
📈 Follow the Money.

While Eagleton claims a 21-point advantage for Sherrill, the financial picture tells a far tighter story.
Since the primary, Sherrill has raised $1.5 million. Ciattarelli? $1.8 million. Both have submitted nearly identical amounts for matching funds, roughly $1.3 million each. In other words: if this race were truly a runaway, the money wouldn’t be this close.
Sherrill’s campaign says it’s about holding “100% MAGA” Ciattarelli accountable. Ciattarelli’s team says he’s out-raising and out-working her, with grassroots momentum stretching across the state.
We don’t take spin at face value. But when money moves, it’s often because voters — and donors — believe a race is real. If Sherrill were up 21, you’d expect donors to start checking out. Instead, they’re doubling down — on both sides.
🇺🇸 A Big Beautiful Victory for Trump.
How About New Jersey?
President Trump closed out a string of high-profile victories — from the Iran ceasefire to a Supreme Court win on judicial authority — with the passage of the One Big Beautiful Bill, a sweeping tax and spending overhaul. It’s being hailed by Republicans as a masterstroke of economic reform, but in New Jersey, the picture is more complicated. The bill brings meaningful short-term tax relief to middle-class households, while also imposing deep structural cuts that could reshape the state’s healthcare safety net for years to come.
The headline wins are hard to ignore. The cap on state and local tax (SALT) deductions — long a sore point for high-tax states like New Jersey — is raised from $10,000 to $40,000 through 2029. Tips and overtime pay are now exempt from federal income tax, and seniors receive a higher standard deduction. These changes directly benefit a wide swath of New Jersey voters, especially in suburban swing districts. Trump’s team is already framing the bill as a declaration of economic freedom for the working and middle class.
But the fine print tells another story. The legislation includes over $1 trillion in cuts to Medicaid, a full repeal of the Affordable Care Act’s expansion, and stricter work requirements for SNAP (food stamps). These aren’t just anti-fraud provisions — they will result in millions of eligible Americans losing coverage, particularly in high-cost, high-need states like New Jersey. The rollback of clean energy tax credits also threatens to stall projects critical to the current administration’s offshore wind and electric vehicle infrastructure goals.
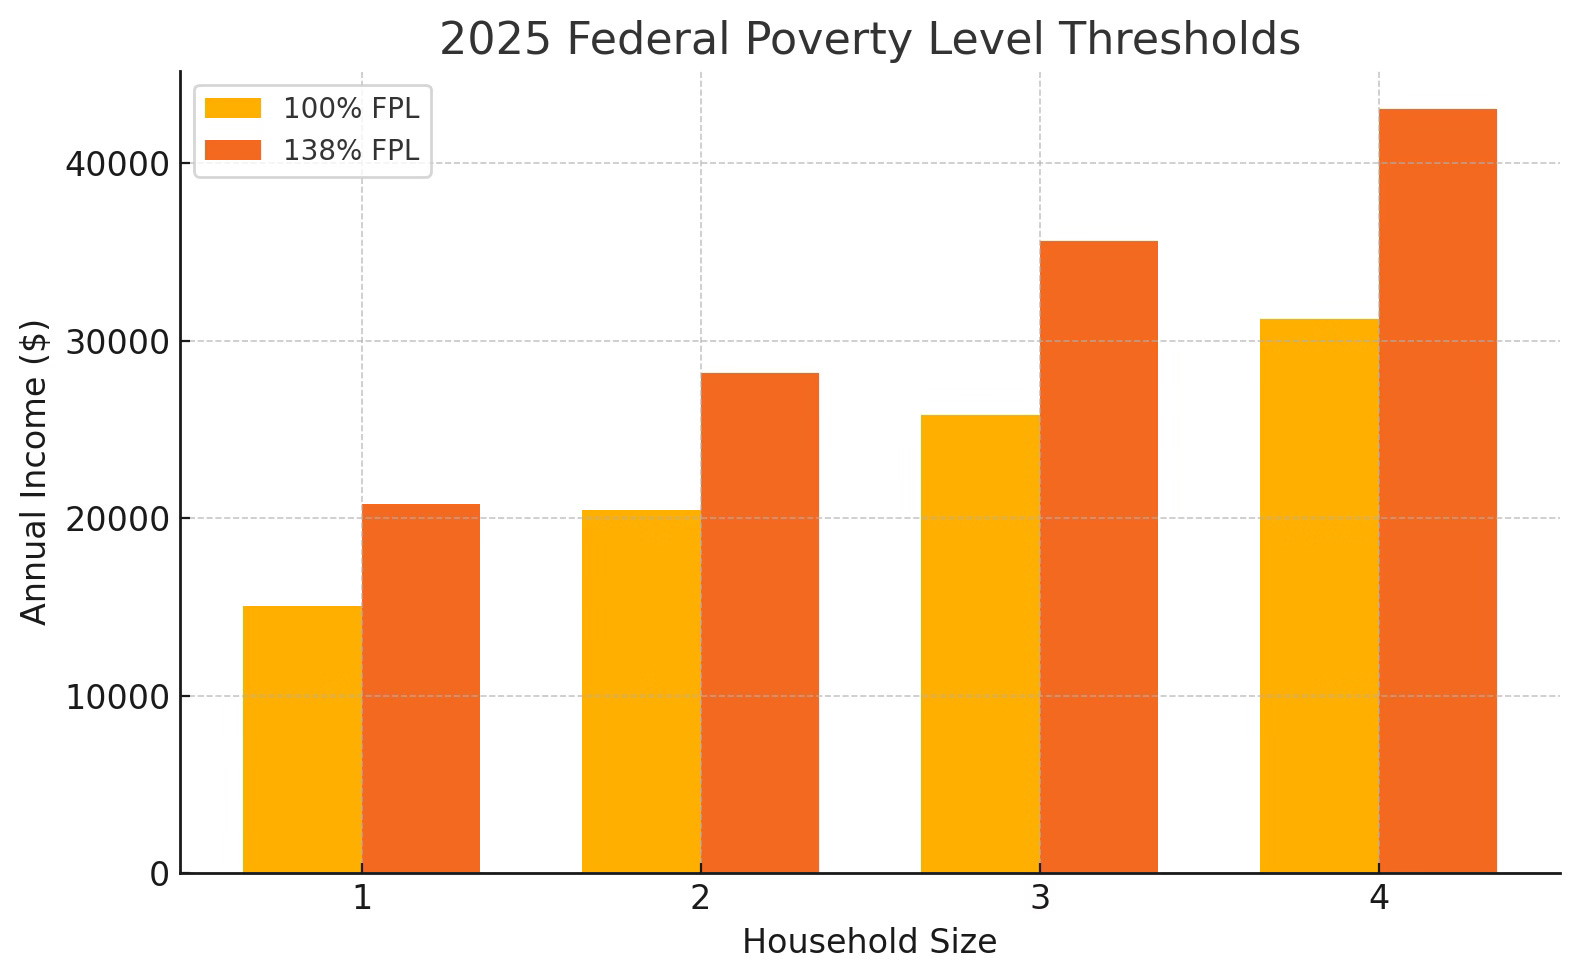
New Jersey, which used ACA funding to expand Medicaid eligibility up to 138% of the federal poverty level (roughly $20,783/year for a single adult in 2025), now faces a stark choice: either cover over 800,000 residents with state dollars, or begin rolling back coverage. Under the bill’s new per-capita cap system, federal funding will no longer adjust to rising medical costs — especially for seniors and people with disabilities.
Counties like Essex, Passaic, Hudson, and Camden will bear the brunt. These areas depend heavily on Medicaid reimbursements to keep hospitals and clinics afloat. The bill also encourages more frequent “eligibility purging” after 2026, using quarterly verification checks that often kick off eligible but vulnerable populations — such as the working poor, immigrants, and unhoused individuals — over paperwork lapses. Over time, the likely result will be higher emergency room traffic, increased medical debt, and possible hospital closures, particularly in urban and underserved areas.
Two Narratives, One Garden State
This is where the framing battle begins.
For Republicans, including Jack Ciattarelli, the message is clear: “This is economic freedom — a declaration of independence from Washington micromanagement and tax burdens.” Expect him to fully embrace the SALT cap increase, the tax exemptions for workers, and the broader theme of efficiency over dependency. Ciattarelli has already shown comfort leaning into Medicaid restructuring as a cost-saving measure for the state. His challenge will be to sell that message in communities most affected by the cuts — and to do so without sounding punitive.
Democrats, on the other hand, are lining up behind a different message: that the bill undermines the social safety net and prioritizes tax cuts for wealthier states at the expense of the working poor. Mikie Sherrill — who voted against the bill — criticized it in a short statement as “a raw deal for working families and seniors in New Jersey,” highlighting the Medicaid and SNAP rollbacks and the removal of green energy incentives. But she has yet to offer a compelling counter-vision or statewide alternative.
Sherrill’s vote places her squarely in opposition to a bill that will now be delivering tax relief to many of her own constituents. That tension will not go unnoticed.
Expect Ciattarelli to press the contrast: “She voted no on SALT relief and no on tax cuts for working families.” And unless Sherrill articulates a broader economic plan — beyond protecting ACA-era programs — that line could stick.
⚖️ How Much Weight Does It Carry?
From a modeling perspective, this bill is a unique challenge. It’s both a short-term political win and a long-term structural shift. Voters will feel the immediate benefits this year — larger paychecks, smaller tax bills. But the cuts to Medicaid and SNAP may take longer to materialize in the public consciousness, especially among low-engagement voters.
ZPI’s calibration model weights perceived economic benefit more heavily in the near term. That gives Trump — and by extension, Ciattarelli — a measurable boost, especially among middle-income suburbanites and independent men. The backlash to safety net cuts, if it comes, will be slower and may depend on whether Democrats can connect the dots between this bill and rising costs at hospitals, schools, and local governments.
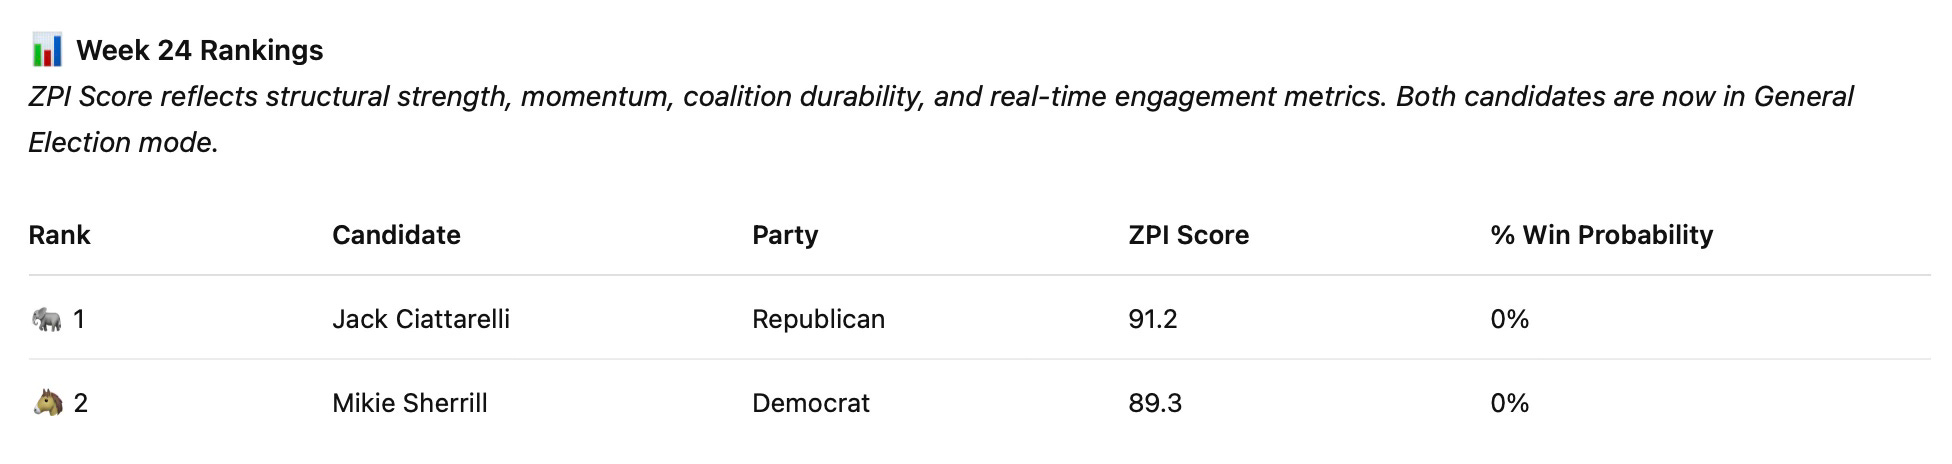
📉 The 1.9-point gap isn’t about polls. It’s about posture.
Both campaigns are structurally sound—but their strategies are radically different. One is consolidating with speed. The other is still recalibrating with caution.
🔺 1. Ciattarelli’s Lead Is Narrow — But Earned
He’s not leading because the map favors him—it doesn’t. He’s leading because the momentum does.
The Trump endorsement locked in the right, and his campaign has stayed relentlessly focused on economics, crime, and affordability—issues that continue to dominate digital engagement and independent sentiment.
“Don’t chase Essex. Win Bergen. Win Monmouth. Win Morris.”
That’s the internal mantra—and it’s working. His campaign is running a lean, turnout-first strategy aimed at flipping just enough working-class Democrats to matter.
🔺 2. Sherrill Has the Bigger Tent — But More Tension
Her coalition is broader, but not yet fully stable. The primary win proved her institutional strength, but she still hasn’t consolidated her younger progressive left.
Her engagement numbers have improved—but still lag behind Ciattarelli’s on high-emotion, high-turnout issues like taxes, crime, and cost of living.
If she tightens the emotional connection by Labor Day, she has a solid opportunity to overtake him. But for now, the rankings are flatlined.
🔺 3. Digital Signals Still Favor Ciattarelli
Our X poll (3,362 votes, 37K+ views) showed a +14 edge for Ciattarelli. That’s not absolute science—but it’s a meaningful directional signal. Especially when engagement quality, turnout probability, and demographic behavior are factored in. And, though it is early in our calibration, we are seeing similar results from Facebook.
Meanwhile, Sherrill leads in traditional polling—but most of it (like Eagleton’s) is based on adult samples, not likely voters. That gap in methodology explains the diverging narratives.
🧭 What the ZPI Model Sees
Ciattarelli’s message is crisper. His coalition is tighter.
He doesn’t have to patch things up post-primary — the GOP is unified and disciplined behind him. That means more volunteers, cleaner field ops, and less noise. Add to that Trump’s recent momentum nationally, and you’ve got a Republican base that’s not just activated, but aligned.
Sherrill, meanwhile, has institutional power — but internal friction.
Labor is with her. So are major donors. But her left flank is skeptical, digital engagement is tepid, and her coalition — while large — isn’t yet locked in. She’s still rebuilding trust with progressives, and her campaign is adjusting to a general electorate that’s more economically anxious than ideologically loyal.
So yes: Sherrill has resources. But Ciattarelli has rhythm.
👤 The Human-AI Factor
Our readers know this isn’t just software. I’ve been in campaigns. I’ve worked field ops, handed out campaign literature, bumper stickers, buttons, knocked doors in the freezing rain and held candidate banners at train stations during early commuter hours. I know what a pivot looks like. I know when a campaign is bluffing. And I’ve trained our AI to flag not just the data—but the drama.
We call it augmented intelligence. The AI flags the patterns. I flag the nonsense.
Together, we ask better questions. Like: if one poll says it’s a landslide, and every other signal says it’s a slog, who’s pushing the outlier — and why?
🧭 What This Is Really About
This isn’t just a polling dispute. This is about the information ecosystem that shapes turnout, media coverage, and perception. When a public institution drops a poll like Eagleton did this week—and it’s wildly misaligned with every other reputable signal and data point—we have to ask: what narrative are they enabling?
Because if they’re wrong again, that headline will still linger. The damage is already done. And nobody ever circles back to issue the correction.
So we’re doing it now.
We are not just watching the race.
We are holding them accountable
We don’t poll for headlines. We model for outcomes. That’s the Zoose difference.
🔥 8 Minutes a Week with ZPI = More Political Insight Than Most Insiders.
🔹 About Zoose® and Patrick Allocco
Zoose® is an award-winning technology company founded by Patrick Allocco, a veteran campaign operative and former Congressional candidate. Built on multi-patented AI and human-to-human communication tools, Zoose solves real-time challenges across industries—from global support services to political intelligence.
At the forefront of its civic innovation is the Zoose Political Index (ZPI)—a nonpartisan, AI-powered election analysis platform that delivers weekly rankings, turnout modeling, and data-driven insights. ZPI has become a trusted source for understanding the evolving dynamics of the 2025 New Jersey Governor’s race and soon beyond.
Patrick Allocco has advised and worked on campaigns at every level—State Senate, Congress, U.S. Senate, gubernatorial, and Presidential—giving him a uniquely practical perspective on voter behavior and strategic messaging. His experience in field operations and coalition-building fuels Zoose’s mission to cut through the noise with clarity, accuracy, and impact.
In 2024, Allocco was recognized in Who’s Who in America for U.S. Technology for his contributions to innovation and AI driven solutions.
Thanks for this analysis. I was completely taken aback by the Eagleton Poll. As for Sherrill's broad coalition, I have not seen any efforts from the campaign to reach Fulop's voters. In fact, I am in her district and an elected Dem county committee member (Essex), and I don't see much campaigning nor enthusiasm about her campaign.